Oct 19, 2025 | Power BI |
1. Introduction to Audience Analytics for Media Companies
Audience Analytics for Media Companies is critical for understanding viewer behavior, engagement patterns, and content performance. In today’s digital-first world, media companies need actionable insights to stay competitive.
Why Is Audience Analytics Important?
- Content Optimization: Identify what resonates with your audience.
- Revenue Growth: Align advertising strategies with audience trends.
- Personalization: Deliver tailored experiences to increase engagement.
Audience Analytics for Media Companies empowers decision-makers with data-driven strategies for growth.
2. Why Microsoft Power BI?
Microsoft Power BI is a leading business intelligence tool that transforms raw data into interactive dashboards and actionable insights.
Why Use Power BI for Media Analytics?
- Integration: Connects with streaming platforms, CRM, and ad servers.
- Visualization: Offers dynamic dashboards for real-time insights.
- Scalability: Handles large datasets from multiple sources.
- Predictive Analytics: Enables forecasting for audience trends.
3. 10 Ways Microsoft Power BI Enhances Audience Analytics
Here are ten practical ways Power BI transforms audience analytics for media companies:
1. Real-Time Audience Dashboards
Monitor live engagement metrics across platforms.
Benefit: Make quick decisions during broadcasts.
2. Multi-Platform Data Integration
Combine data from TV, OTT, social media, and websites.
Benefit: Get a unified view of audience behavior.
3. Demographic Analysis
Visualize age, gender, and location data.
Benefit: Target content and ads effectively.
4. Content Performance Tracking
Analyze which shows or articles drive the most engagement.
Benefit: Optimize programming schedules.
5. Predictive Analytics
Forecast audience trends using historical data.
Benefit: Plan campaigns and content strategies proactively.
6. Advertising ROI Measurement
Track ad performance and revenue attribution.
Benefit: Maximize advertiser satisfaction.
7. Sentiment Analysis
Integrate social listening tools for audience sentiment.
Benefit: Understand viewer opinions in real time.
8. Subscription Analytics
Monitor churn rates and subscription growth.
Benefit: Improve retention strategies.
9. Mobile Engagement Insights
Analyze app usage and push notification effectiveness.
Benefit: Enhance mobile-first strategies.
10. Automated Reporting
Schedule and share reports with stakeholders.
Benefit: Save time and improve collaboration.
4. Key Benefits of Microsoft Power BI in Media Analytics
- Real-Time Insights: Make faster decisions during live events.
- Improved Accuracy: Consolidates data from multiple sources.
- Enhanced Visualization: Interactive dashboards simplify complex data.
- Predictive Capabilities: Anticipate audience trends.
- Cost Efficiency: Reduces manual reporting efforts.
5. Common Use Cases
- OTT Platforms: Track viewer engagement and subscription trends.
- Broadcast Networks: Monitor live ratings and ad performance.
- Digital Publishers: Analyze article performance and audience demographics.
- Advertising Agencies: Measure campaign ROI and audience reach.
6. Real-World Examples of Microsoft Power BI in Audience Analytics
Here are detailed examples of how media companies use Power BI:
Example 1: Global Streaming Service
A leading OTT platform uses Power BI to integrate data from multiple regions.
- Dashboards show real-time viewer engagement and subscription trends.
- Result: Improved content recommendations and reduced churn by 20%.
Example 2: News Network
A major news broadcaster leverages Power BI for content performance tracking.
- Identifies top-performing segments and optimizes airtime.
- Result: Increased prime-time ratings by 15%.
Example 3: Digital Media Publisher
An online publisher uses Power BI for advertising ROI measurement.
- Tracks ad impressions, clicks, and conversions across campaigns.
- Result: Boosted ad revenue by 25% through better targeting.
Example 4: Sports Media Company
A sports broadcaster integrates Power BI with social listening tools.
- Provides sentiment analysis during live matches.
- Result: Enhanced fan engagement and sponsorship deals.
7. Step-by-Step Guide to Setup Microsoft Power BI
Follow these steps to implement Power BI for audience analytics:
- Sign in to Power BI: Access via Microsoft 365 portal.
- Connect Data Sources: Integrate streaming platforms, CRM, and ad servers.
- Build Dashboards: Use templates for audience metrics and engagement.
- Apply Filters: Segment data by demographics and platforms.
- Share Reports: Schedule automated reports for stakeholders.
Pro Tip: Use Power BI Premium for advanced AI and predictive analytics.
8. Best Practices
- Define KPIs Clearly: Focus on metrics that matter most.
- Ensure Data Quality: Validate sources before integration.
- Use Role-Based Access: Protect sensitive audience data.
- Leverage AI Features: Enable forecasting and anomaly detection.
- Regularly Update Dashboards: Keep insights fresh and relevant.
9. Challenges and How to Overcome
While Power BI simplifies analytics, media companies may face challenges:
- Data Integration Complexity: Use connectors and APIs effectively.
- User Adoption: Provide training for editorial and marketing teams.
- Cost Management: Monitor premium feature usage.
- Data Privacy Compliance: Ensure GDPR and regional compliance.
Solution: Start with core dashboards and scale gradually.
10. Conclusion
Microsoft Power BI transforms audience analytics for media companies by providing real-time insights, predictive capabilities, and interactive dashboards. Businesses that embrace Power BI gain a competitive edge in content strategy and audience engagement.
🚀 Ready to Unlock Audience Insights?
Whether you’re running a streaming platform, a news outlet, or a digital media agency, Power BI can help you understand your audience like never before.
👉 Let Motekx help you get started.
We specialize in digital transformation for media companies—offering free consulting, custom Power BI dashboards, and end-to-end analytics solutions tailored to your needs.
📞 Contact us today to schedule a free discovery session.
📧 Email: info@motekx.be
Let’s build smarter, data-driven media experiences—together.

Oct 19, 2025 | Power BI |
1. Introduction to Visualizing Sustainability Metrics for Energy Providers
Visualizing Sustainability Metrics for Energy Providers is essential for meeting regulatory requirements, improving operational efficiency, and achieving environmental goals. Energy companies face increasing pressure to track carbon emissions, renewable energy usage, and compliance with ESG standards.
Why Is Sustainability Visualization Important?
- Regulatory Compliance: Meet government and industry reporting standards.
- Transparency: Share sustainability progress with stakeholders.
- Operational Efficiency: Identify areas for energy optimization.
Visualizing Sustainability Metrics for Energy Providers empowers organizations to make data-driven decisions for a greener future.
2. Why Microsoft Power BI?
Microsoft Power BI is a leading business intelligence tool that transforms raw sustainability data into interactive dashboards and actionable insights.
Why Use Power BI for Sustainability Metrics?
- Integration: Connects with IoT sensors, ERP systems, and energy management platforms.
- Visualization: Offers dynamic dashboards for real-time sustainability tracking.
- Scalability: Handles large datasets from multiple energy sources.
- Predictive Analytics: Enables forecasting for carbon reduction and renewable adoption.
3. 10 Ways Microsoft Power BI Enhances Sustainability Visualization
Here are ten practical ways Power BI helps energy providers visualize sustainability metrics:
1. Carbon Emission Dashboards
Track CO₂ emissions across plants and regions.
Benefit: Identify high-emission areas for corrective action.
2. Renewable Energy Usage Reports
Visualize the percentage of energy sourced from renewables.
Benefit: Monitor progress toward sustainability goals.
3. Energy Efficiency Metrics
Analyze consumption patterns and efficiency ratios.
Benefit: Reduce waste and optimize operations.
4. Water Usage Analytics
Track water consumption in energy production processes.
Benefit: Support conservation initiatives.
5. Waste Management Visualization
Monitor waste generation and recycling rates.
Benefit: Improve compliance and reduce environmental impact.
6. ESG Compliance Dashboards
Aggregate data for environmental, social, and governance reporting.
Benefit: Simplify audits and investor reporting.
7. Predictive Sustainability Modeling
Forecast future emissions and renewable adoption trends.
Benefit: Plan long-term sustainability strategies.
8. Real-Time IoT Data Integration
Connect sensors for live monitoring of energy and resource usage.
Benefit: Enable proactive decision-making.
9. Benchmarking Against Industry Standards
Compare sustainability performance with peers.
Benefit: Identify gaps and set realistic targets.
10. Automated Reporting
Schedule and share sustainability reports with stakeholders.
Benefit: Save time and ensure transparency.
4. Key Benefits of Microsoft Power BI for Energy Providers
- Real-Time Insights: Monitor sustainability metrics instantly.
- Improved Accuracy: Consolidates data from multiple sources.
- Enhanced Visualization: Interactive dashboards simplify complex data.
- Predictive Capabilities: Anticipate future trends and risks.
- Cost Efficiency: Reduces manual reporting efforts.
5. Common Use Cases
- Carbon Footprint Analysis: Track emissions across facilities.
- Renewable Energy Monitoring: Measure solar, wind, and hydro contributions.
- Regulatory Reporting: Automate compliance submissions.
- Stakeholder Dashboards: Share sustainability progress with investors.
- Energy Optimization: Identify inefficiencies and reduce costs.
6. Real-World Examples of Microsoft Power BI for Energy Providers
Here are detailed examples of how energy companies use Power BI:
Example 1: Global Energy Corporation
A multinational energy provider uses Power BI to integrate data from multiple plants.
- Dashboards show real-time carbon emissions and renewable energy usage.
- Result: Achieved a 15% reduction in emissions within one year.
Example 2: Regional Utility Company
A utility firm leverages Power BI for water usage and waste management visualization.
- Identifies high-consumption areas and implements conservation measures.
- Result: Reduced water usage by 20% and improved recycling rates.
Example 3: Renewable Energy Startup
A solar energy company uses Power BI for predictive sustainability modeling.
- Forecasts renewable adoption trends and optimizes resource allocation.
- Result: Increased operational efficiency and investor confidence.
Example 4: ESG-Focused Enterprise
An energy provider integrates Power BI with ESG compliance tools.
- Automates reporting for investors and regulators.
- Result: Reduced reporting time by 50% and improved transparency.
7. Step-by-Step Guide to Setup Microsoft Power BI
Follow these steps to implement Power BI for sustainability metrics:
- Sign in to Power BI: Access via Microsoft 365 portal.
- Connect Data Sources: Integrate IoT sensors, ERP, and energy management systems.
- Build Dashboards: Use templates for carbon emissions and renewable energy.
- Apply Filters: Segment data by region, plant, and resource type.
- Share Reports: Schedule automated reports for stakeholders.
Pro Tip: Use Power BI Premium for advanced AI and predictive analytics.
8. Best Practices
- Define KPIs Clearly: Focus on metrics that matter most for sustainability.
- Ensure Data Quality: Validate sources before integration.
- Use Role-Based Access: Protect sensitive environmental data.
- Leverage AI Features: Enable forecasting and anomaly detection.
- Regularly Update Dashboards: Keep insights fresh and relevant.
9. Challenges and How to Overcome
While Power BI simplifies sustainability visualization, energy providers may face challenges:
- Data Integration Complexity: Use connectors and APIs effectively.
- User Adoption: Provide training for sustainability and operations teams.
- Cost Management: Monitor premium feature usage.
- Data Privacy Compliance: Ensure adherence to environmental reporting standards.
Solution: Start with core dashboards and scale gradually.
10. Conclusion
Microsoft Power BI transforms sustainability reporting for energy providers by offering real-time insights, predictive capabilities, and interactive dashboards. Companies that embrace Power BI gain a competitive edge in meeting environmental goals and regulatory compliance.
🚀 Ready to Power Your Sustainability Goals?
Whether you’re managing a single plant or a global energy network, Power BI can help you visualize and achieve your sustainability targets.
👉 Let Motekx help you get started.
We specialize in digital transformation for energy providers—offering free consulting, custom Power BI dashboards, and end-to-end analytics solutions tailored to your needs.
📞 Contact us today to schedule a free discovery session.
📧 Email: info@motekx.be
Let’s build a cleaner, smarter, and more sustainable energy future—together.
Oct 19, 2025 | Power BI |
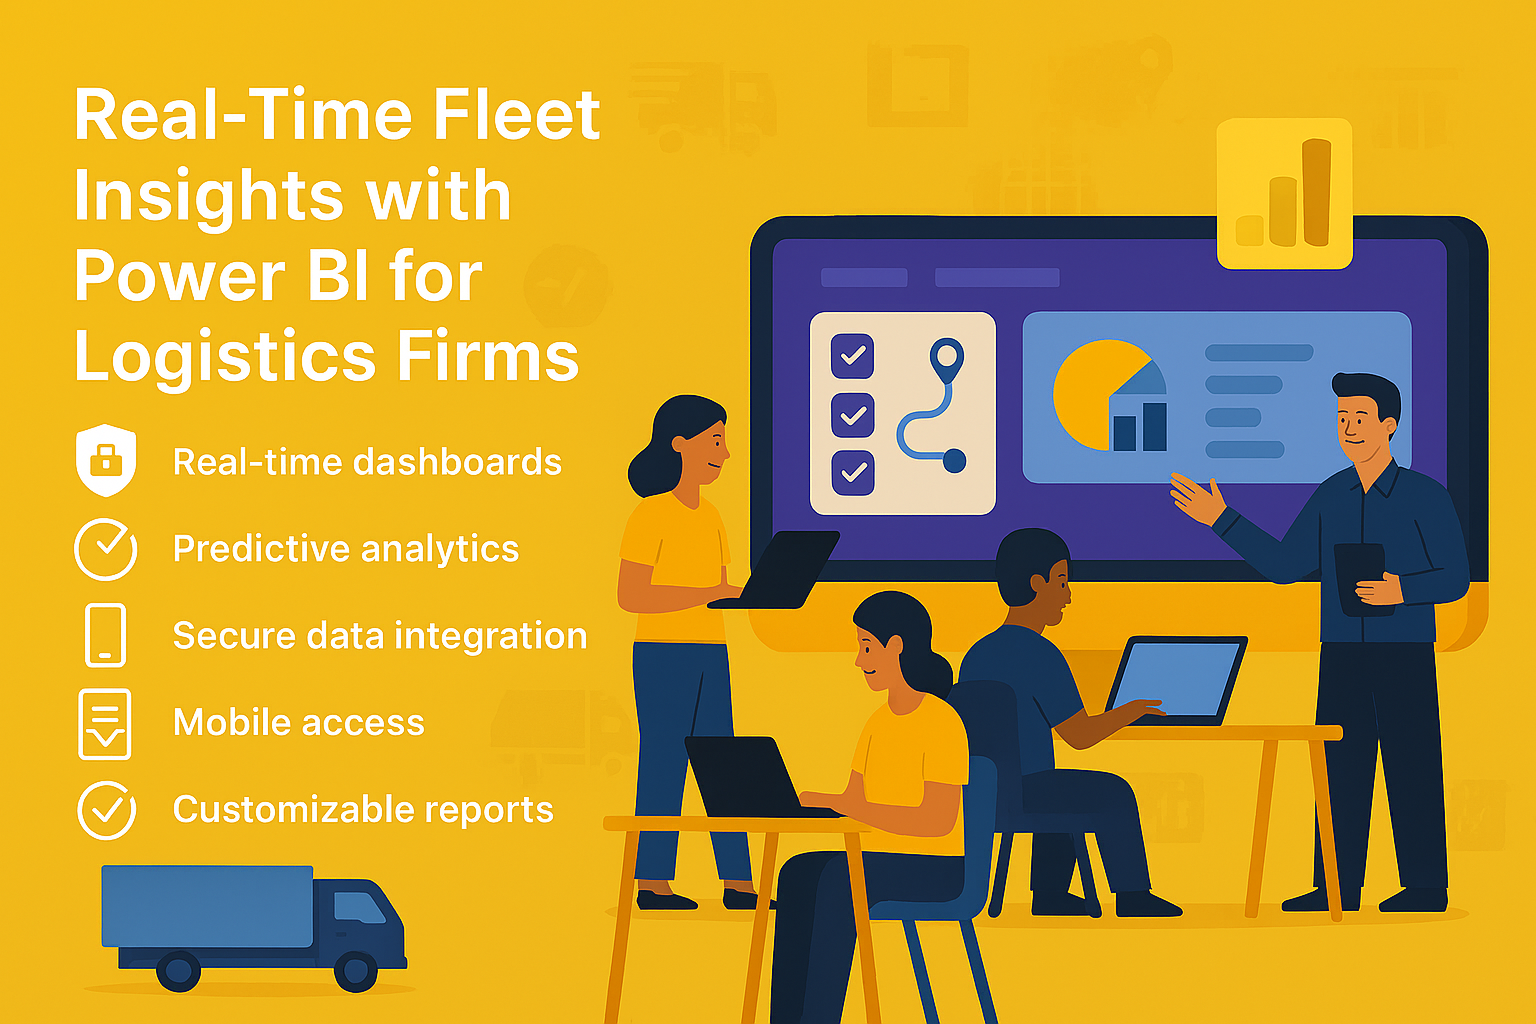
1. Introduction to Real-Time Fleet Insights for Logistics Firms
Real-Time Fleet Insights for Logistics Firms are essential for optimizing operations, reducing costs, and improving customer satisfaction. With growing demand for faster deliveries and efficient routing, logistics companies need actionable data at their fingertips.
Why Are Real-Time Insights Important?
- Operational Efficiency: Reduce idle time and optimize routes.
- Cost Control: Monitor fuel consumption and maintenance costs.
- Customer Experience: Provide accurate delivery ETAs and updates.
Real-Time Fleet Insights for Logistics Firms empower businesses to make data-driven decisions for better performance and profitability.
2. Why Microsoft Power BI?
Microsoft Power BI is a powerful business intelligence tool that transforms raw fleet data into interactive dashboards and actionable insights.
Why Use Power BI for Fleet Analytics?
- Integration: Connects with GPS systems, IoT sensors, and ERP platforms.
- Visualization: Offers dynamic dashboards for real-time fleet monitoring.
- Scalability: Handles large datasets from multiple vehicles and regions.
- Predictive Analytics: Enables forecasting for maintenance and route optimization.
3. 10 Ways Microsoft Power BI Enhances Fleet Insights
Here are ten practical ways Power BI helps logistics firms gain real-time fleet insights:
1. Live Vehicle Tracking
Monitor vehicle locations in real time using GPS data.
Benefit: Improves route planning and reduces delays.
2. Fuel Consumption Analysis
Visualize fuel usage trends across the fleet.
Benefit: Identify inefficiencies and reduce costs.
3. Driver Performance Dashboards
Track speed, idle time, and compliance metrics.
Benefit: Enhance safety and productivity.
4. Predictive Maintenance Alerts
Forecast maintenance needs based on historical data.
Benefit: Prevent breakdowns and reduce downtime.
5. Route Optimization Insights
Analyze delivery routes for time and cost efficiency.
Benefit: Improve delivery speed and reduce fuel costs.
6. Load Utilization Metrics
Monitor cargo weight and space utilization.
Benefit: Maximize capacity and reduce empty miles.
7. Compliance and Safety Reporting
Generate reports for regulatory compliance and audits.
Benefit: Avoid penalties and maintain safety standards.
8. Customer Delivery ETAs
Provide accurate estimated delivery times using real-time data.
Benefit: Enhance customer satisfaction.
9. Cost Analysis Dashboards
Track operational costs including fuel, maintenance, and tolls.
Benefit: Improve budgeting and profitability.
10. Automated Reporting
Schedule and share fleet performance reports with stakeholders.
Benefit: Save time and improve collaboration.
4. Key Benefits of Microsoft Power BI for Logistics Firms
- Real-Time Insights: Monitor fleet performance instantly.
- Improved Accuracy: Consolidates data from multiple sources.
- Enhanced Visualization: Interactive dashboards simplify complex data.
- Predictive Capabilities: Anticipate maintenance and route issues.
- Cost Efficiency: Reduces manual reporting efforts.
5. Common Use Cases
- Fleet Tracking: Monitor vehicle locations and routes.
- Fuel Efficiency Analysis: Identify high-consumption vehicles.
- Driver Behavior Monitoring: Improve safety and compliance.
- Maintenance Forecasting: Reduce downtime with predictive alerts.
- Customer Service Dashboards: Provide real-time delivery updates.
6. Real-World Examples of Microsoft Power BI for Fleet Insights
Here are detailed examples of how logistics firms use Power BI:
Example 1: Global Logistics Provider
A multinational logistics company uses Power BI to integrate GPS and IoT data.
- Dashboards show real-time vehicle locations, fuel consumption, and driver performance.
- Result: Reduced delivery delays by 25% and improved fuel efficiency by 15%.
Example 2: Regional Delivery Service
A regional courier service leverages Power BI for predictive maintenance and route optimization.
- Forecasts maintenance needs and optimizes delivery routes.
- Result: Cut maintenance costs by 20% and improved on-time delivery rates.
Example 3: E-Commerce Logistics Partner
An e-commerce logistics firm uses Power BI for customer delivery ETAs and compliance reporting.
- Provides accurate delivery times and automates compliance reports.
- Result: Increased customer satisfaction scores and reduced audit preparation time.
Example 4: Freight Transport Company
A freight company integrates Power BI with ERP systems for cost analysis dashboards.
- Tracks operational costs and identifies cost-saving opportunities.
- Result: Improved profitability by 12% through better resource allocation.
7. Step-by-Step Guide to Setup Microsoft Power BI
Follow these steps to implement Power BI for fleet analytics:
- Sign in to Power BI: Access via Microsoft 365 portal.
- Connect Data Sources: Integrate GPS, IoT sensors, and ERP systems.
- Build Dashboards: Use templates for fleet tracking and cost analysis.
- Apply Filters: Segment data by region, vehicle type, and driver.
- Share Reports: Schedule automated reports for stakeholders.
Pro Tip: Use Power BI Premium for advanced AI and predictive analytics.
8. Best Practices
- Define KPIs Clearly: Focus on metrics that matter most for fleet performance.
- Ensure Data Quality: Validate sources before integration.
- Use Role-Based Access: Protect sensitive operational data.
- Leverage AI Features: Enable forecasting and anomaly detection.
- Regularly Update Dashboards: Keep insights fresh and relevant.
9. Challenges and How to Overcome
While Power BI simplifies fleet analytics, logistics firms may face challenges:
- Data Integration Complexity: Use connectors and APIs effectively.
- User Adoption: Provide training for operations and analytics teams.
- Cost Management: Monitor premium feature usage.
- Data Privacy Compliance: Ensure adherence to transportation regulations.
Solution: Start with core dashboards and scale gradually.
10. Conclusion
Microsoft Power BI transforms fleet management for logistics firms by providing real-time insights, predictive capabilities, and interactive dashboards. Companies that embrace Power BI gain a competitive edge in operational efficiency and customer satisfaction.
🚀 Ready to Drive Smarter Logistics Decisions?
Whether you manage a small fleet or a global logistics network, Power BI can give you the real-time insights you need to stay ahead.
👉 Let Motekx help you get started.
We specialize in digital transformation for logistics—offering free consulting, custom Power BI dashboards, and end-to-end analytics solutions tailored to your needs.
📞 Contact us today to schedule a free discovery session.
📧 Email: info@motekx.be
Let’s build smarter, faster, and more connected logistics—together.