okt 19, 2025 | Power BI |
1. Introductie tot publieksanalyse voor mediabedrijven
Publieksanalyse voor mediabedrijven is cruciaal voor het begrijpen van kijkersgedrag, engagementpatronen en contentprestaties. In de huidige digitale wereld hebben mediabedrijven bruikbare inzichten nodig om concurrerend te blijven.
Waarom is publieksanalyse belangrijk?
- Contentoptimalisatie: Identificeer wat resoneert bij uw publiek.
- Omzetgroei: Stem advertentiestrategieën af op publiekstrends.
- Personalisatie: Lever op maat gemaakte ervaringen om betrokkenheid te vergroten.
Publieksanalyse voor mediabedrijven stelt besluitvormers in staat om datagestuurde strategieën voor groei te ontwikkelen.
2. Waarom Microsoft Power BI?
Microsoft Power BI is een toonaangevende business intelligence-tool die ruwe gegevens omzet in interactieve dashboards en bruikbare inzichten.
Waarom Power BI gebruiken voor media-analyse?
- Integratie: Verbindt met streamingplatforms, CRM en advertentieservers.
- Visualisatie: Biedt dynamische dashboards voor realtime inzichten.
- Schaalbaarheid: Verwerkt grote datasets uit meerdere bronnen.
- Voorspellende analyse: Maakt voorspellingen van publiekstrends mogelijk.
3. 10 manieren waarop Microsoft Power BI publieksanalyse verbetert
Hier zijn tien praktische manieren waarop Power BI publieksanalyse voor mediabedrijven transformeert:
1. Realtime publieksdashboards
Monitor live engagementmetrieken over platforms heen.
Voordeel: Neem snelle beslissingen tijdens uitzendingen.
2. Multi-platform data-integratie
Combineer gegevens van tv, OTT, sociale media en websites.
Voordeel: Krijg een uniform beeld van publieksgedrag.
3. Demografische analyse
Visualiseer gegevens over leeftijd, geslacht en locatie.
Voordeel: Richt content en advertenties effectief.
4. Tracking van contentprestaties
Analyseer welke shows of artikelen de meeste betrokkenheid genereren.
Voordeel: Optimaliseer programmeeringsschema’s.
5. Voorspellende analyse
Voorspel publiekstrends met behulp van historische gegevens.
Voordeel: Plan campagnes en contentstrategieën proactief.
6. ROI-meting van advertenties
Volg advertentieprestaties en omzetattributie.
Voordeel: Maximaliseer adverteerderstevredenheid.
7. Sentimentanalyse
Integreer social listening-tools voor publiekssentiment.
Voordeel: Begrijp kijkersmeningen in realtime.
8. Abonnementsanalyse
Monitor churn-percentages en abonnementsgroei.
Voordeel: Verbeter retentiestrategieën.
9. Inzichten in mobiele betrokkenheid
Analyseer app-gebruik en effectiviteit van push-meldingen.
Voordeel: Verbeter mobile-first strategieën.
10. Geautomatiseerde Rapportage
Plan en deel rapporten met belanghebbenden.
Voordeel: Bespaar tijd en verbeter samenwerking.
4. Belangrijkste voordelen van Microsoft Power BI in media-analyse
- Realtime inzichten: Neem sneller beslissingen tijdens live-evenementen.
- Verbeterde Nauwkeurigheid: Consolideert gegevens uit meerdere bronnen.
- Verbeterde Visualisatie: Interactieve dashboards vereenvoudigen complexe gegevens.
- Voorspellende mogelijkheden: Anticipeer op publiekstrends.
- Kostenefficiëntie: Vermindert handmatige rapportage-inspanningen.
5. Veelvoorkomende toepassingen
- OTT-platforms: Volg kijkersbetrokkenheid en abonnementstrends.
- Omroepnetwerken: Monitor live kijkcijfers en advertentieprestaties.
- Digitale uitgevers: Analyseer artikelprestaties en publieksdemografie.
- Reclamebureaus: Meet campagne-ROI en publieksbereik.
6. Praktijkvoorbeelden van Microsoft Power BI in publieksanalyse
Hier zijn gedetailleerde voorbeelden van hoe mediabedrijven Power BI gebruiken:
Voorbeeld 1: Wereldwijde streamingdienst
Een toonaangevend OTT-platform gebruikt Power BI om gegevens uit meerdere regio’s te integreren.
- Dashboards tonen realtime kijkersbetrokkenheid en abonnementstrends.
- Resultaat: Verbeterde contentaanbevelingen en 20% minder churn.
Voorbeeld 2: Nieuwsnetwerk
Een grote nieuwszender gebruikt Power BI voor tracking van contentprestaties.
- Identificeert best presterende segmenten en optimaliseert zendtijd.
- Resultaat: 15% toename in prime-time kijkcijfers.
Voorbeeld 3: Digitale mediauitgever
Een online uitgever gebruikt Power BI voor ROI-meting van advertenties.
- Volgt advertentie-impressies, kliks en conversies over campagnes heen.
- Resultaat: 25% toename in advertentie-inkomsten door betere targeting.
Voorbeeld 4: Sportmediabedrijf
Een sportomroep integreert Power BI met social listening-tools.
- Biedt sentimentanalyse tijdens live wedstrijden.
- Resultaat: Verbeterde fanbetrokkenheid en sponsordeals.
7. Stap-voor-Stap Gids voor het Instellen van Microsoft Power BI
Volg deze stappen om Power BI te implementeren voor publieksanalyse:
- Inloggen op Power BI: Toegang via Microsoft 365 portal.
- Verbind gegevensbronnen: Integreer streamingplatforms, CRM en advertentieservers.
- Bouw dashboards: Gebruik templates voor publieksmetrieken en betrokkenheid.
- Pas filters toe: Segmenteer gegevens op basis van demografie en platforms.
- Rapporten Delen: Plan geautomatiseerde rapporten voor belanghebbenden.
Pro Tip: Gebruik Power BI Premium voor geavanceerde AI en voorspellende analyses.
8. Best practices
- Definieer KPI’s duidelijk: Focus op de meest relevante metrieken.
- Zorg voor Gegevenskwaliteit: Valideer bronnen voor integratie.
- Gebruik rolgebaseerde toegang: Bescherm gevoelige publieksgegevens.
- Benut AI-functies: Schakel voorspelling en anomaliedetectie in.
- Update Dashboards Regelmatig: Houd inzichten fris en relevant.
9. Uitdagingen en hoe deze te overwinnen
Hoewel Power BI analyse vereenvoudigt, kunnen mediabedrijven uitdagingen tegenkomen:
- Complexiteit van Gegevensintegratie: Gebruik connectoren en API’s effectief.
- Gebruikersadoptie: Bied training aan redactie- en marketingteams.
- Kostenbeheer: Monitor het gebruik van premium functies.
- Naleving van gegevensprivacy: Zorg voor GDPR- en regionale naleving.
Oplossing: Begin met kern dashboards en schaal geleidelijk op.
10. Conclusie
Microsoft Power BI transformeert publieksanalyse voor mediabedrijven door realtime inzichten, voorspellende mogelijkheden en interactieve dashboards te bieden. Bedrijven die Power BI omarmen, krijgen een concurrentievoordeel in contentstrategie en publieksbetrokkenheid.
🚀 Klaar om publieksanalyse te ontgrendelen?
Of u nu een streamingplatform, een nieuwsorganisatie of een digitaal mediabureau runt, Power BI kan u helpen uw publiek beter te begrijpen dan ooit tevoren.
👉 Laat Motekx u helpen om te beginnen.
Wij zijn gespecialiseerd in digitale transformatie voor mediabedrijven en bieden gratis advies, aangepaste Power BI-dashboards en end-to-end analyseoplossingen op maat van uw behoeften.
📞 Neem vandaag nog contact met ons op om een gratis kennismakingsgesprek in te plannen.
📧 E-mail: info@motekx.be
Laten we samen slimmere, datagestuurde media-ervaringen bouwen.

okt 19, 2025 | Power BI |
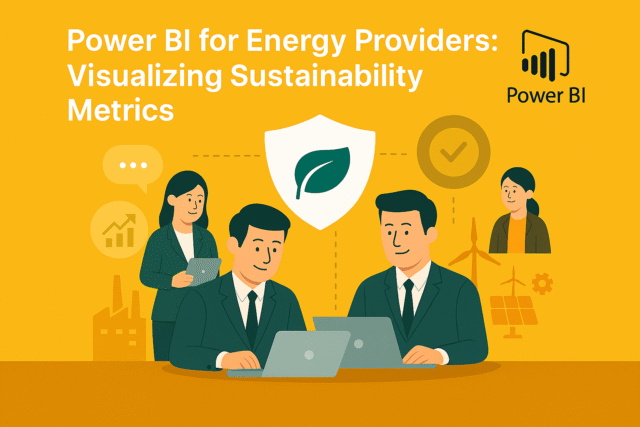
1. Introduction to Visualizing Sustainability Metrics for Energy Providers
Visualizing Sustainability Metrics for Energy Providers is essential for meeting regulatory requirements, improving operational efficiency, and achieving environmental goals. Energy companies face increasing pressure to track carbon emissions, renewable energy usage, and compliance with ESG standards.
Why Is Sustainability Visualization Important?
- Regulatory Compliance: Meet government and industry reporting standards.
- Transparency: Share sustainability progress with stakeholders.
- Operational Efficiency: Identify areas for energy optimization.
Visualizing Sustainability Metrics for Energy Providers empowers organizations to make data-driven decisions for a greener future.
2. Why Microsoft Power BI?
Microsoft Power BI is a leading business intelligence tool that transforms raw sustainability data into interactive dashboards and actionable insights.
Why Use Power BI for Sustainability Metrics?
- Integration: Connects with IoT sensors, ERP systems, and energy management platforms.
- Visualization: Offers dynamic dashboards for real-time sustainability tracking.
- Scalability: Handles large datasets from multiple energy sources.
- Predictive Analytics: Enables forecasting for carbon reduction and renewable adoption.
3. 10 Ways Microsoft Power BI Enhances Sustainability Visualization
Here are ten practical ways Power BI helps energy providers visualize sustainability metrics:
1. Carbon Emission Dashboards
Track CO₂ emissions across plants and regions.
Benefit: Identify high-emission areas for corrective action.
2. Renewable Energy Usage Reports
Visualize the percentage of energy sourced from renewables.
Benefit: Monitor progress toward sustainability goals.
3. Energy Efficiency Metrics
Analyze consumption patterns and efficiency ratios.
Benefit: Reduce waste and optimize operations.
4. Water Usage Analytics
Track water consumption in energy production processes.
Benefit: Support conservation initiatives.
5. Waste Management Visualization
Monitor waste generation and recycling rates.
Benefit: Improve compliance and reduce environmental impact.
6. ESG Compliance Dashboards
Aggregate data for environmental, social, and governance reporting.
Benefit: Simplify audits and investor reporting.
7. Predictive Sustainability Modeling
Forecast future emissions and renewable adoption trends.
Benefit: Plan long-term sustainability strategies.
8. Real-Time IoT Data Integration
Connect sensors for live monitoring of energy and resource usage.
Benefit: Enable proactive decision-making.
9. Benchmarking Against Industry Standards
Compare sustainability performance with peers.
Benefit: Identify gaps and set realistic targets.
10. Automated Reporting
Schedule and share sustainability reports with stakeholders.
Benefit: Save time and ensure transparency.
4. Key Benefits of Microsoft Power BI for Energy Providers
- Real-Time Insights: Monitor sustainability metrics instantly.
- Improved Accuracy: Consolidates data from multiple sources.
- Enhanced Visualization: Interactive dashboards simplify complex data.
- Predictive Capabilities: Anticipate future trends and risks.
- Cost Efficiency: Reduces manual reporting efforts.
5. Common Use Cases
- Carbon Footprint Analysis: Track emissions across facilities.
- Renewable Energy Monitoring: Measure solar, wind, and hydro contributions.
- Regulatory Reporting: Automate compliance submissions.
- Stakeholder Dashboards: Share sustainability progress with investors.
- Energy Optimization: Identify inefficiencies and reduce costs.
6. Real-World Examples of Microsoft Power BI for Energy Providers
Here are detailed examples of how energy companies use Power BI:
Example 1: Global Energy Corporation
A multinational energy provider uses Power BI to integrate data from multiple plants.
- Dashboards show real-time carbon emissions and renewable energy usage.
- Result: Achieved a 15% reduction in emissions within one year.
Example 2: Regional Utility Company
A utility firm leverages Power BI for water usage and waste management visualization.
- Identifies high-consumption areas and implements conservation measures.
- Result: Reduced water usage by 20% and improved recycling rates.
Example 3: Renewable Energy Startup
A solar energy company uses Power BI for predictive sustainability modeling.
- Forecasts renewable adoption trends and optimizes resource allocation.
- Result: Increased operational efficiency and investor confidence.
Example 4: ESG-Focused Enterprise
An energy provider integrates Power BI with ESG compliance tools.
- Automates reporting for investors and regulators.
- Result: Reduced reporting time by 50% and improved transparency.
7. Step-by-Step Guide to Setup Microsoft Power BI
Follow these steps to implement Power BI for sustainability metrics:
- Sign in to Power BI: Access via Microsoft 365 portal.
- Connect Data Sources: Integrate IoT sensors, ERP, and energy management systems.
- Build Dashboards: Use templates for carbon emissions and renewable energy.
- Apply Filters: Segment data by region, plant, and resource type.
- Share Reports: Schedule automated reports for stakeholders.
Pro Tip: Use Power BI Premium for advanced AI and predictive analytics.
8. Best Practices
- Define KPIs Clearly: Focus on metrics that matter most for sustainability.
- Ensure Data Quality: Validate sources before integration.
- Use Role-Based Access: Protect sensitive environmental data.
- Leverage AI Features: Enable forecasting and anomaly detection.
- Regularly Update Dashboards: Keep insights fresh and relevant.
9. Challenges and How to Overcome
While Power BI simplifies sustainability visualization, energy providers may face challenges:
- Data Integration Complexity: Use connectors and APIs effectively.
- User Adoption: Provide training for sustainability and operations teams.
- Cost Management: Monitor premium feature usage.
- Data Privacy Compliance: Ensure adherence to environmental reporting standards.
Solution: Start with core dashboards and scale gradually.
10. Conclusion
Microsoft Power BI transforms sustainability reporting for energy providers by offering real-time insights, predictive capabilities, and interactive dashboards. Companies that embrace Power BI gain a competitive edge in meeting environmental goals and regulatory compliance.
🚀 Ready to Power Your Sustainability Goals?
Whether you’re managing a single plant or a global energy network, Power BI can help you visualize and achieve your sustainability targets.
👉 Let Motekx help you get started.
We specialize in digital transformation for energy providers—offering free consulting, custom Power BI dashboards, and end-to-end analytics solutions tailored to your needs.
📞 Contact us today to schedule a free discovery session.
📧 Email: info@motekx.be
Let’s build a cleaner, smarter, and more sustainable energy future—together.
okt 19, 2025 | Power BI |
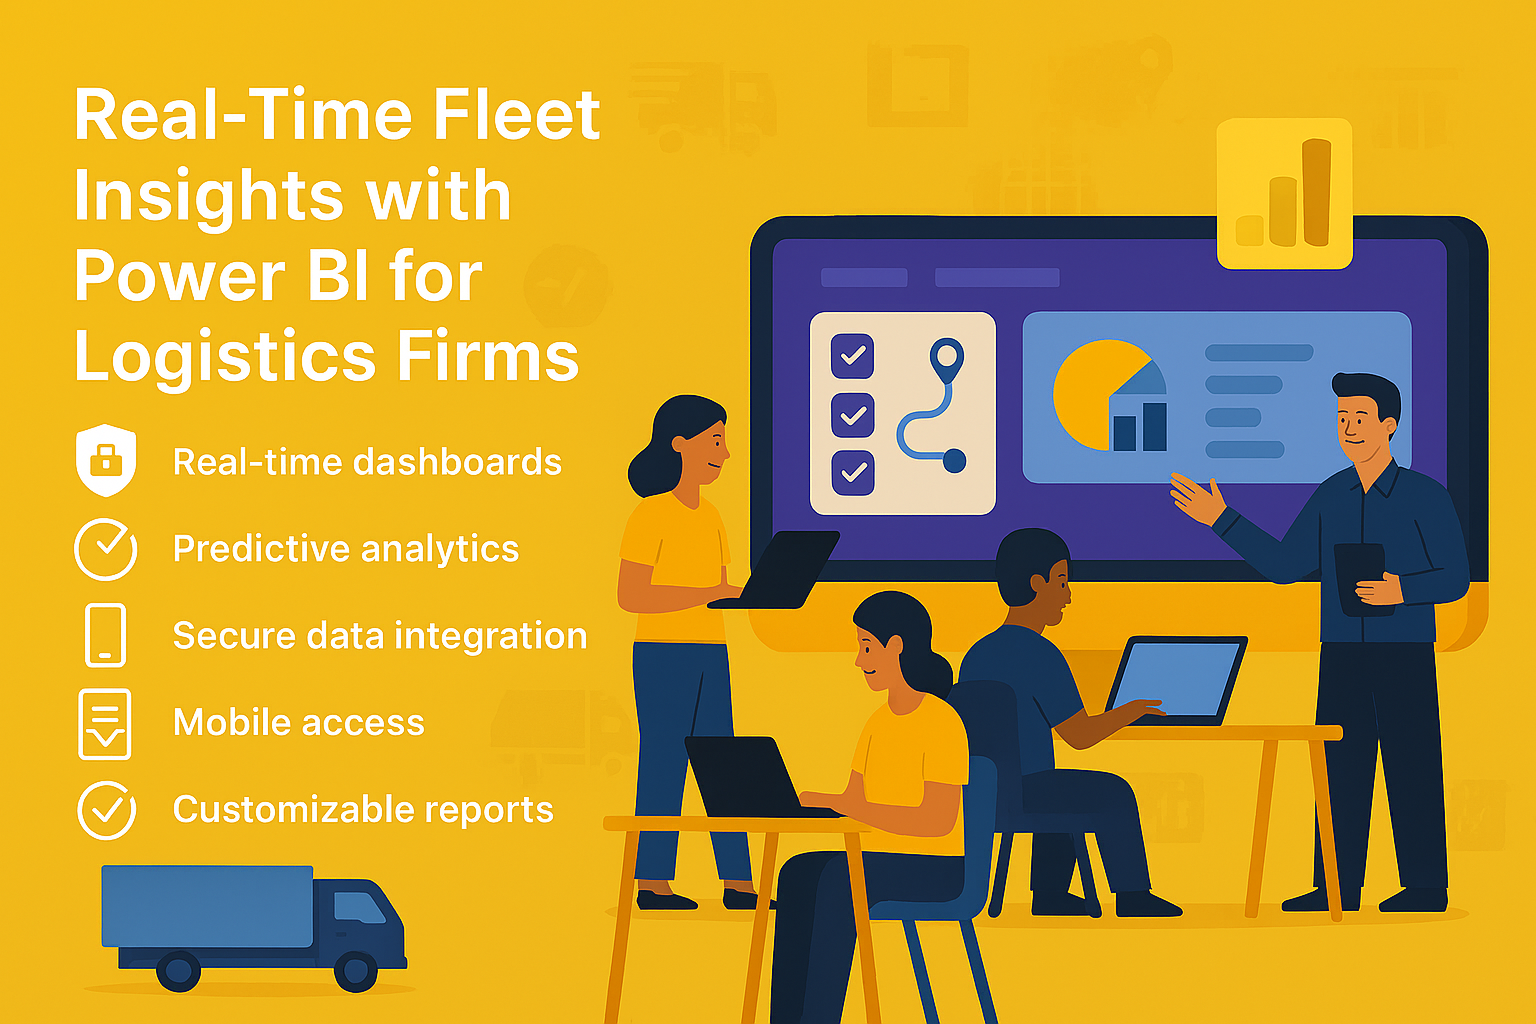
1. Introduction to Real-Time Fleet Insights for Logistics Firms
Real-Time Fleet Insights for Logistics Firms are essential for optimizing operations, reducing costs, and improving customer satisfaction. With growing demand for faster deliveries and efficient routing, logistics companies need actionable data at their fingertips.
Why Are Real-Time Insights Important?
- Operational Efficiency: Reduce idle time and optimize routes.
- Cost Control: Monitor fuel consumption and maintenance costs.
- Customer Experience: Provide accurate delivery ETAs and updates.
Real-Time Fleet Insights for Logistics Firms empower businesses to make data-driven decisions for better performance and profitability.
2. Why Microsoft Power BI?
Microsoft Power BI is a powerful business intelligence tool that transforms raw fleet data into interactive dashboards and actionable insights.
Why Use Power BI for Fleet Analytics?
- Integration: Connects with GPS systems, IoT sensors, and ERP platforms.
- Visualization: Offers dynamic dashboards for real-time fleet monitoring.
- Scalability: Handles large datasets from multiple vehicles and regions.
- Predictive Analytics: Enables forecasting for maintenance and route optimization.
3. 10 Ways Microsoft Power BI Enhances Fleet Insights
Here are ten practical ways Power BI helps logistics firms gain real-time fleet insights:
1. Live Vehicle Tracking
Monitor vehicle locations in real time using GPS data.
Benefit: Improves route planning and reduces delays.
2. Fuel Consumption Analysis
Visualize fuel usage trends across the fleet.
Benefit: Identify inefficiencies and reduce costs.
3. Driver Performance Dashboards
Track speed, idle time, and compliance metrics.
Benefit: Enhance safety and productivity.
4. Predictive Maintenance Alerts
Forecast maintenance needs based on historical data.
Benefit: Prevent breakdowns and reduce downtime.
5. Route Optimization Insights
Analyze delivery routes for time and cost efficiency.
Benefit: Improve delivery speed and reduce fuel costs.
6. Load Utilization Metrics
Monitor cargo weight and space utilization.
Benefit: Maximize capacity and reduce empty miles.
7. Compliance and Safety Reporting
Generate reports for regulatory compliance and audits.
Benefit: Avoid penalties and maintain safety standards.
8. Customer Delivery ETAs
Provide accurate estimated delivery times using real-time data.
Benefit: Enhance customer satisfaction.
9. Cost Analysis Dashboards
Track operational costs including fuel, maintenance, and tolls.
Benefit: Improve budgeting and profitability.
10. Automated Reporting
Schedule and share fleet performance reports with stakeholders.
Benefit: Save time and improve collaboration.
4. Key Benefits of Microsoft Power BI for Logistics Firms
- Real-Time Insights: Monitor fleet performance instantly.
- Improved Accuracy: Consolidates data from multiple sources.
- Enhanced Visualization: Interactive dashboards simplify complex data.
- Predictive Capabilities: Anticipate maintenance and route issues.
- Cost Efficiency: Reduces manual reporting efforts.
5. Common Use Cases
- Fleet Tracking: Monitor vehicle locations and routes.
- Fuel Efficiency Analysis: Identify high-consumption vehicles.
- Driver Behavior Monitoring: Improve safety and compliance.
- Maintenance Forecasting: Reduce downtime with predictive alerts.
- Customer Service Dashboards: Provide real-time delivery updates.
6. Real-World Examples of Microsoft Power BI for Fleet Insights
Here are detailed examples of how logistics firms use Power BI:
Example 1: Global Logistics Provider
A multinational logistics company uses Power BI to integrate GPS and IoT data.
- Dashboards show real-time vehicle locations, fuel consumption, and driver performance.
- Result: Reduced delivery delays by 25% and improved fuel efficiency by 15%.
Example 2: Regional Delivery Service
A regional courier service leverages Power BI for predictive maintenance and route optimization.
- Forecasts maintenance needs and optimizes delivery routes.
- Result: Cut maintenance costs by 20% and improved on-time delivery rates.
Example 3: E-Commerce Logistics Partner
An e-commerce logistics firm uses Power BI for customer delivery ETAs and compliance reporting.
- Provides accurate delivery times and automates compliance reports.
- Result: Increased customer satisfaction scores and reduced audit preparation time.
Example 4: Freight Transport Company
A freight company integrates Power BI with ERP systems for cost analysis dashboards.
- Tracks operational costs and identifies cost-saving opportunities.
- Result: Improved profitability by 12% through better resource allocation.
7. Step-by-Step Guide to Setup Microsoft Power BI
Follow these steps to implement Power BI for fleet analytics:
- Sign in to Power BI: Access via Microsoft 365 portal.
- Connect Data Sources: Integrate GPS, IoT sensors, and ERP systems.
- Build Dashboards: Use templates for fleet tracking and cost analysis.
- Apply Filters: Segment data by region, vehicle type, and driver.
- Share Reports: Schedule automated reports for stakeholders.
Pro Tip: Use Power BI Premium for advanced AI and predictive analytics.
8. Best Practices
- Define KPIs Clearly: Focus on metrics that matter most for fleet performance.
- Ensure Data Quality: Validate sources before integration.
- Use Role-Based Access: Protect sensitive operational data.
- Leverage AI Features: Enable forecasting and anomaly detection.
- Regularly Update Dashboards: Keep insights fresh and relevant.
9. Challenges and How to Overcome
While Power BI simplifies fleet analytics, logistics firms may face challenges:
- Data Integration Complexity: Use connectors and APIs effectively.
- User Adoption: Provide training for operations and analytics teams.
- Cost Management: Monitor premium feature usage.
- Data Privacy Compliance: Ensure adherence to transportation regulations.
Solution: Start with core dashboards and scale gradually.
10. Conclusion
Microsoft Power BI transforms fleet management for logistics firms by providing real-time insights, predictive capabilities, and interactive dashboards. Companies that embrace Power BI gain a competitive edge in operational efficiency and customer satisfaction.
🚀 Ready to Drive Smarter Logistics Decisions?
Whether you manage a small fleet or a global logistics network, Power BI can give you the real-time insights you need to stay ahead.
👉 Let Motekx help you get started.
We specialize in digital transformation for logistics—offering free consulting, custom Power BI dashboards, and end-to-end analytics solutions tailored to your needs.
📞 Contact us today to schedule a free discovery session.
📧 Email: info@motekx.be
Let’s build smarter, faster, and more connected logistics—together.